

In machine learning, the goal is to teach models to recognize patterns and make decisions based on data. However, sometimes these models pick up on patterns that aren’t actually relevant to the task at hand—these are called spurious correlations. After today’s v2.7.0 release of the cleanlab open-source package, you can now automatically detect spurious correlations along with a host of other common issues that may be lurking in your dataset.
In machine learning, spurious correlations can lead models to make incorrect predictions because they learn to associate irrelevant details with the outcome. It can happen whenever the model might latch onto patterns that don’t genuinely reflect the underlying reality.
The new spurious correlation detection capability lives within our open-source package’s Datalab module, which can detect over 8 types of issues automatically in any dataset. By identifying and quantifying the influence of irrelevant patterns in your dataset, Datalab helps you ensure that your ML model learns the right patterns that properly generalize. This improves the accuracy and robustness of your machine learning models. Addressing spurious correlations if they are detected is essential for training models that perform well not just on your dataset, but also in the real world.
Detecting Image-Specific Spurious Correlations with Datalab
For image data, let’s consider some of the specific correlations that Datalab can detect and why they matter:
Dark images
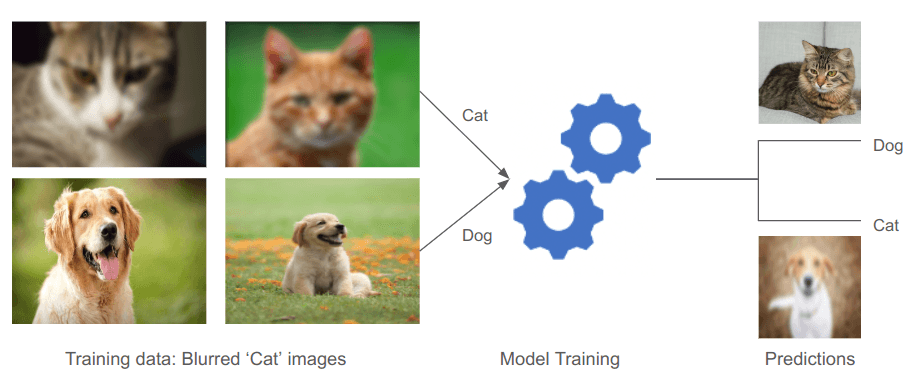
Sometimes, an image might be unusually dark—like a photo taken in poor lighting conditions. If all images of a class (like cats) are unusually dark, the model might learn to associate darkness with that class, leading to poor performance when recognizing well-lit images.

Bright Images
This is the opposite of the dark image issue. Overly bright images can lead the model to wrongly associate brightness with a class, like flowers, making it struggle with normally lit images.

Low-Information Images
Low-information images, like those that are blurry or blank, might cause the model to make incorrect predictions when it encounters more detailed images.

Odd Aspect Ratios
The aspect ratio of an image is the ratio of its width to its height. If images of a class, such as pizzas, have odd aspect ratios, the model might start associating the shape with the class rather than the content.

Odd Sizes
This refers to images that have non-standard dimensions, like being much larger or smaller than typical images in your dataset. Unusually large or small images can cause the model to associate image size with a class, like small images with cars, leading to misclassification.

Grayscale Images
Grayscale images are those without color—just shades of gray. If a dataset contains both color and grayscale images, the model might mistakenly associate the lack of color with a particular class.

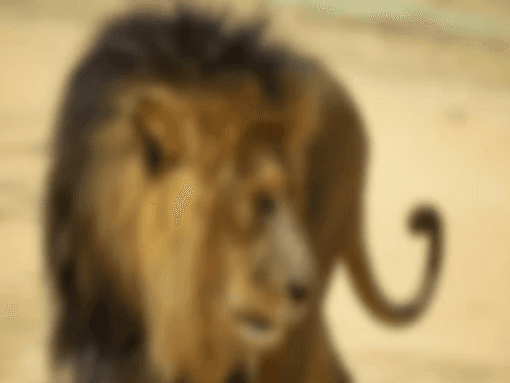
Blurry Images
Blurry images are those where the details and edges appear soft or out of focus. If a model is trained on blurry images, it might not learn the precise features that define an object. Blurry images obscure details, causing the model to associate blurriness with a class, like lions, which could lead to misclassification of clear images.
How ML Performance is Impacted by Spurious Correlations
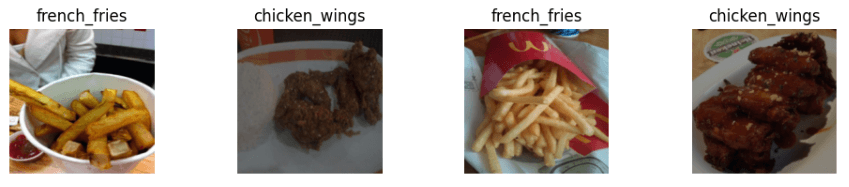
To see how spurious correlations can affect a machine learning model, let’s walk through two practical scenarios. Imagine you’re training a classifier model to recognize different types of food from the Food-101 dataset. We’ll focus on two specific classes: chicken_wings and french_fries.
Scenario 1: A Dataset Affected by Darkened Images
In this first scenario, the dataset is affected by an unintended correlation: all the images of chicken_wings are much darker than those of french_fries. This artificial change doesn’t reflect the true characteristics of chicken_wings, but it creates a misleading pattern that the model might latch onto.
-
What Happened During Training: As the model was trained on this altered dataset, it began associating the darkened images with the chicken_wings class. Instead of learning the true distinguishing features of chicken_wings, the model incorrectly relied on the darkness of the images as a key feature.
-
How It Performed on New Images: When tested on a balanced set of new, unaltered images that were not darkened, the model’s accuracy dropped to about 50%. This significant drop illustrates that the model was misled by the spurious correlation — it was “tricked” into thinking that the level of darkness was an important feature of chicken_wings. In turn, the model failed to generalize correctly to normal, well-lit images.
Scenario 2: A Dataset Highlighting Genuine Features
In the second scenario, the dataset presents the true, unaltered characteristics of both chicken_wings and french_fries. This setup allows the model to focus on the authentic features of the food, such as shape, color, and texture, free from any misleading cues.
-
What Happened During Training: The model learned to identify the real features that distinguish chicken_wings from french_fries. It minimized errors over time, improving its ability to recognize the food correctly.
-
How It Performed on New Images: When tested on new, unseen images that were also unaltered, the model achieved high accuracy, correctly identifying about 75% of the food items. This high accuracy indicates that the model learned the relevant features needed for accurate recognition.

Takeaway
By comparing these two scenarios, it’s clear how important it is to train models on data without spurious correlations. In the first scenario, the presence of spurious correlations (the darkness) caused the model to make mistakes. But in the second scenario, the model learned the right features and performed well. It’s like teaching someone that all dogs are brown—if they see a white dog, they might not recognize it as a dog at all. This is why it’s crucial to avoid misleading information in your training data so the model can generalize and perform well on new, real-world data.
Here is a notebook to reproduce all results presented in this article.
Detecting Spurious Correlations using Datalab
Spurious correlations in image datasets can be detected easily by Datalab using merely the following few lines of code. Currently, Datalab supports only Hugging Face datasets for this purpose.
In the first scenario above, the dataset was affected by an unintended correlation where images of chicken_wings were darker than those of other class. To quantify the impact of this spurious correlation, Datalab analyzes various properties of the images and how they relate to the class labels. For this blog post, we’ve focused on the dark_score as a key indicator of this issue. The dark_score is a measure of the darkness level for each image. To assess how this darkness might correlate with the class labels, Datalab calculates an uncorrelatedness score for this property, which is part of the label_uncorrelatedness_scores dataframe. This score indicates how uncorrelated the darkness of the images is with the class labels—a lower score suggests a stronger correlation, which could imply a potential issue with how the model might learn from this dataset.
Here’s an example of the label_uncorrelatedness_scores for the dataset, highlighting the uncorrelatedness score for the dark_score property:
| property | score |
|---|---|
| odd_size_score | 0.5150 |
| odd_aspect_ratio_score | 0.4650 |
| low_information_score | 0.0900 |
| light_score | 0.2200 |
| grayscale_score | 0.5000 |
| dark_score | 0.0325 |
| blurry_score | 0.3875 |
The low dark_score highlights the extent to which the model may be influenced by irrelevant details. In this case, the model’s reliance on darkness as a feature rather than focusing on the true characteristics of chicken_wings leads to poor generalization on new, well-lit images of chicken_wings. This demonstrates the importance of addressing spurious correlations to ensure that models learn meaningful patterns.
In the second scenario, using images that more accurately reflected the true characteristics of each food item, resulted in higher model accuracy and a more balanced dark_score. This suggests that the model was less likely to be misled by irrelevant factors, focusing instead on the actual features that distinguish the classes.
The lab.report() function gives a detailed analysis of the dataset, focusing not only on image issues but also other potential issues in the dataset. Specifically for spurious correlations, it filters image properties with high correlations to class labels, along with their respective label uncorrelatedness scores. Additionally, the report highlights specific instances in the dataset with the minimum and maximum values for each correlated image property, providing insights into the extent of these correlations.
Here’s the relevant section of the report for the spuriously correlated dataset, the one having darker chicken_wings images.
Conclusion
In the complex landscape of machine learning, the integrity of your data is paramount. Spurious correlations, though often subtle, can mislead models into learning patterns that are detrimental to their performance in the real world. By effectively detecting and addressing these correlations, you can ensure that your models focus on the features that truly generalize.
Datalab emerges as a powerful tool in this endeavor, offering a streamlined approach to identifying these hidden pitfalls in your image datasets. Ultimately, the ability to detect and mitigate spurious correlations is not just a technical challenge—it’s a critical step toward creating machine learning models that are both effective and resilient. With tools like Datalab, data scientists and engineers are better equipped to navigate this challenge, paving the way for more accurate, fair, and trustworthy AI systems.
Resources
- Quickstart Tutorial for using Datalab to audit your own datasets.
- Example Notebook to reproduce the results presented in this article.
- cleanlab open-source library just released v2.7.0 containing the spurious correlation detection functionality and other new features. Star the repo to support open-source Data-Centric AI!
- Cleanlab Slack Community: See how others are using Cleanlab and discuss the future of Data-Centric AI.