


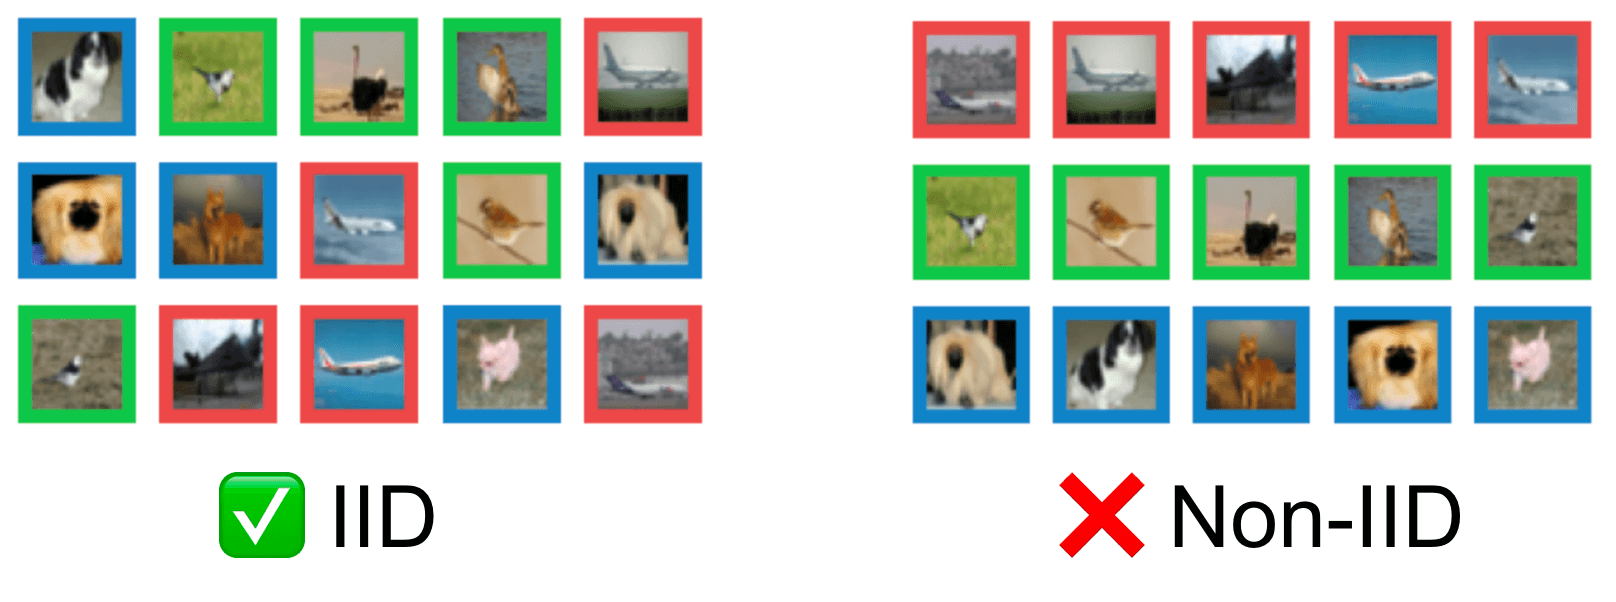
Most Machine Learning, Data Science, and Statistics/Analytics efforts proceed under the foundational assumption that the data are Independent and Identically Distributed (IID). To reliably generalize to the population underlying the data, one assumes each datapoint does not affect the others (independent) and that the population is not changing as datapoints are being collected (identically distributed). In settings that violate these assumptions, data-driven inference cannot be trusted unless done with special care.
Real-world data collection can be messy and hard to know whether data was sampled in a strictly IID fashion. Our newest paper, Detecting Dataset Drift and Non-IID Sampling via k-Nearest Neighbors presents a straightforward analysis to help you answer this question, i.e. does the order in which my data were collected matter? Our algorithm has been open-sourced in the cleanlab package for you to easily check your own datasets.
Our kNN method should be applied to datasets in their original sequential ordering. Although shuffling the order of your dataset is an effective way to make your data appear IID, it remains important to determine if the underlying data collection or generation process is actually IID. IID violations may imply your dataset is not fully representative of the population and future data could look different – issues that cannot be addressed just by shuffling the datapoints’ order.
If the data distribution drifts over time in a ML application, then the most recently collected data will better represent future deployment conditions. In this case, holding-out this latest data is a more reliable way to estimate model performance vs. shuffling the dataset and using a random train/test split. This is just one example out of many [1,2,3,4,5,6] where special actions are preferred once we realize the data are not IID. Hence why we built software that can detect when this is the case!
Unfortunately, non-IID data comes in all shapes and sizes and, in general, it is impossible to detect all the ways that a dataset can be non-IID. However, cleanlab’s kNN method effectively diagnoses most forms of IID violations that appear in real-world applications, as we demonstrate in this article. The same technique generalizes across most data modalities (images, text, audio, tables, etc), and can be applied to any data for which you can produce vector feature representations (e.g. model embeddings). Refer to our paper for additional details/benchmarks of our approach.
Non-IID detection using numerical data features (or embeddings)
Our method is quite straightforward. The key idea is to consider whether or not datapoints that are closer in the data ordering (i.e. time) also tend to have more similar feature values. In an IID dataset, this will not be the case. Note our method only detects violations of the IID assumption which exhibit this property, but these are the most common violations in practice (e.g. due to data drift, or lack of independence between datapoints where recently-collected datapoints influence the datapoint sampled next to have similar feature values).
Given a numerical representation of a dataset (obtained by numerically transforming the data features, perhaps via embeddings from a trained model), we construct a k-Nearest Neighbor graph of the dataset based on these feature values. A pair of datapoints is considered neighbors or non-neighbors based on this kNN graph (not their indices in the dataset ordering). Next we consider the indices of the datapoints (perhaps determined by the time each was collected), and compute the index distance between datapoint and as (e.g. the index distance between the 8th datapoint and the 108th datapoint is 100). Cleanlab applies a two-sample permutation test using the Kolmogorov-Smirnov statistic in order to determine if there is a statistically significant difference between the distributions of index distances between kNN-neighbors (the foreground distribution) vs. index distances between arbitrary datapoint pairs (the background distribution). A low -value implies that neighbors and non-neighbors in feature space are systematically ordered in certain patterns, indicating the data was sampled in a non-IID manner.
Using cleanlab to detect if data is non-IID
Detecting non-IID data is very easy with the open-source cleanlab library (as of version 2.4.0). Once you have a numerical representation of your data, here’s all you need:
Here’s a notebook that repeatedly runs this same code on many different datasets, which can reproduce all the results presented in this article.
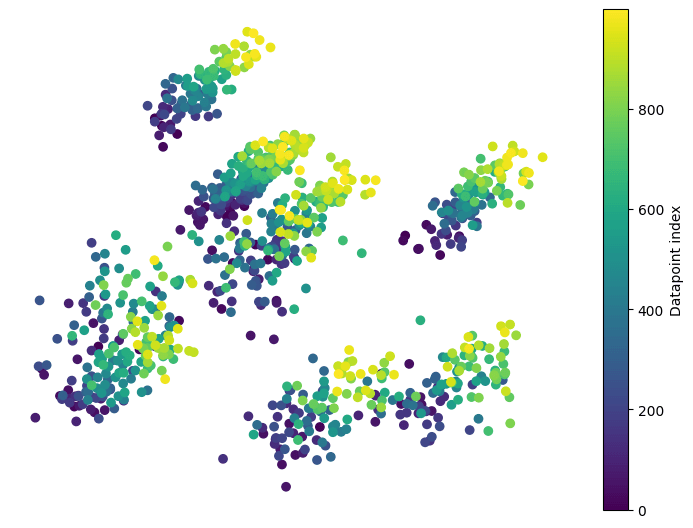
Using cleanlab to detect non-IID data is simple but powerful. In the toy dataset pictured below, the data is sampled from a distribution in which the variance increases suddenly halfway through collection. This would be difficult to spot if you were just given this dataset without our additional coloring. However, when we run the above code on this dataset, the resulting p-value is within machine-precision of 0 indicating that this data is strongly non-IID.
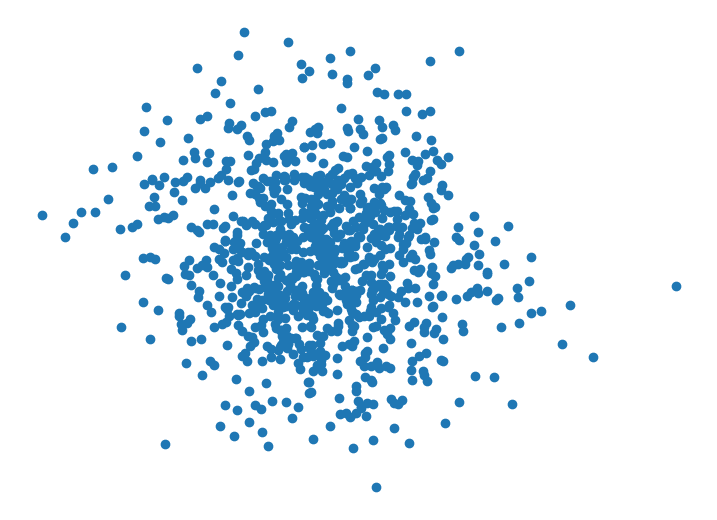
Next, we draw random samples from the initial Gaussian mixture distribution with no variance shift to create a truly IID dataset depicted below.
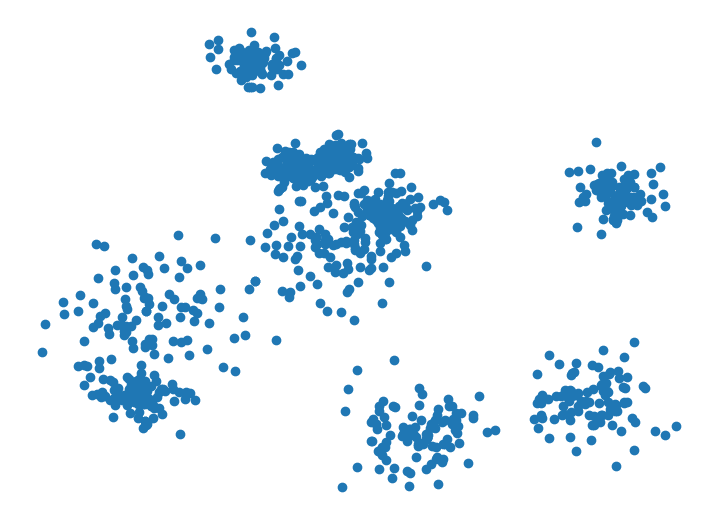
Running the same code on this truly IID dataset, cleanlab reports a p-value of around 0.5, indicating it found little evidence to suggest the data are not IID.
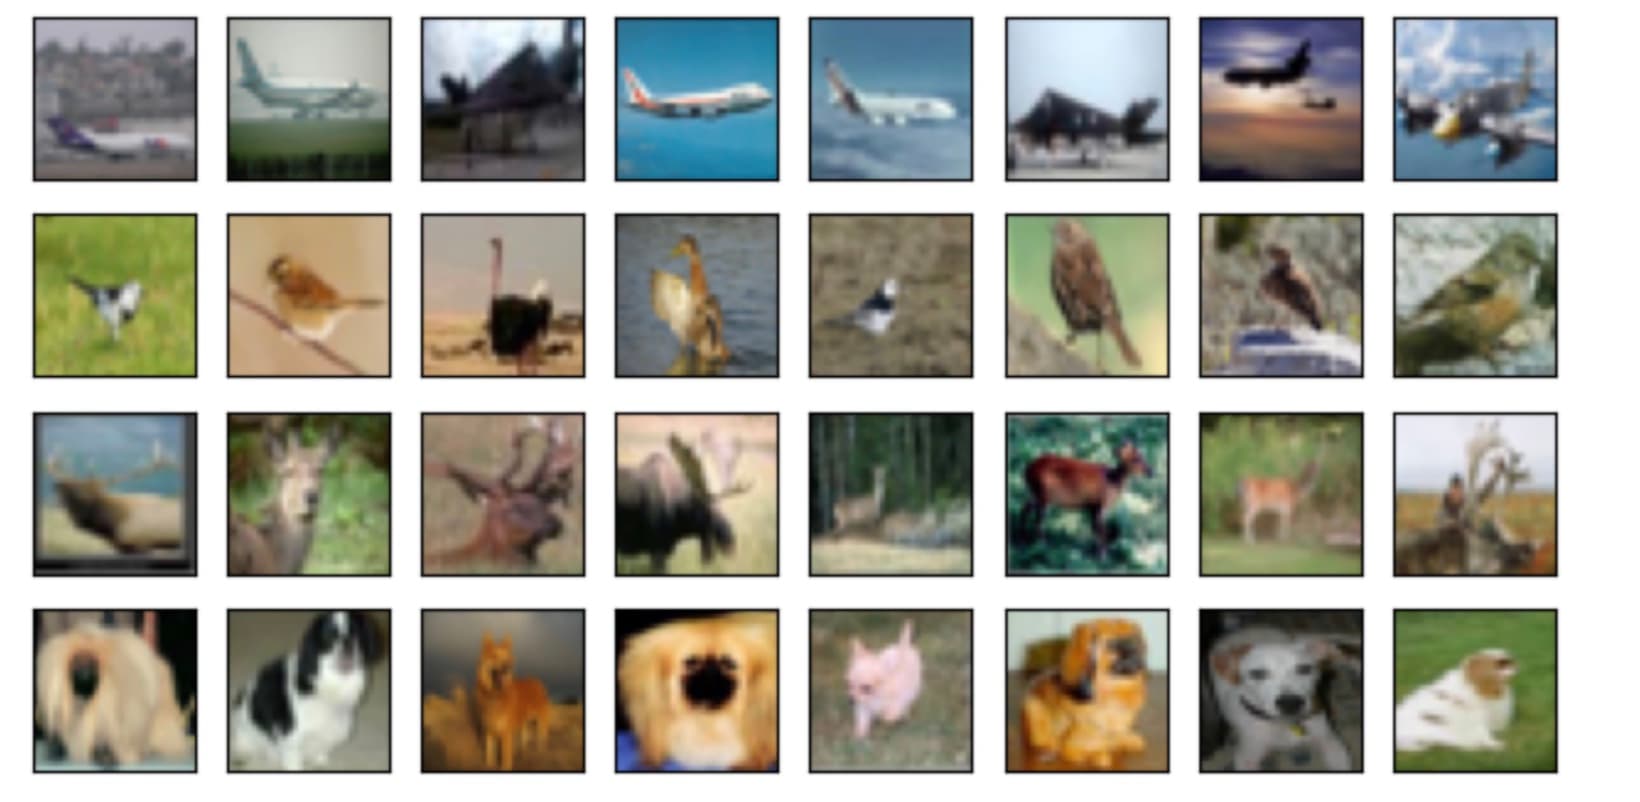
The same code also works with image data. In this next example, our dataset consists of 2,500 random images from CIFAR-10, but it also contains a small contiguous subset of 250 images that are drawn all from the same class halfway through the dataset order. This dataset looks like a (much) bigger version of the grid below.
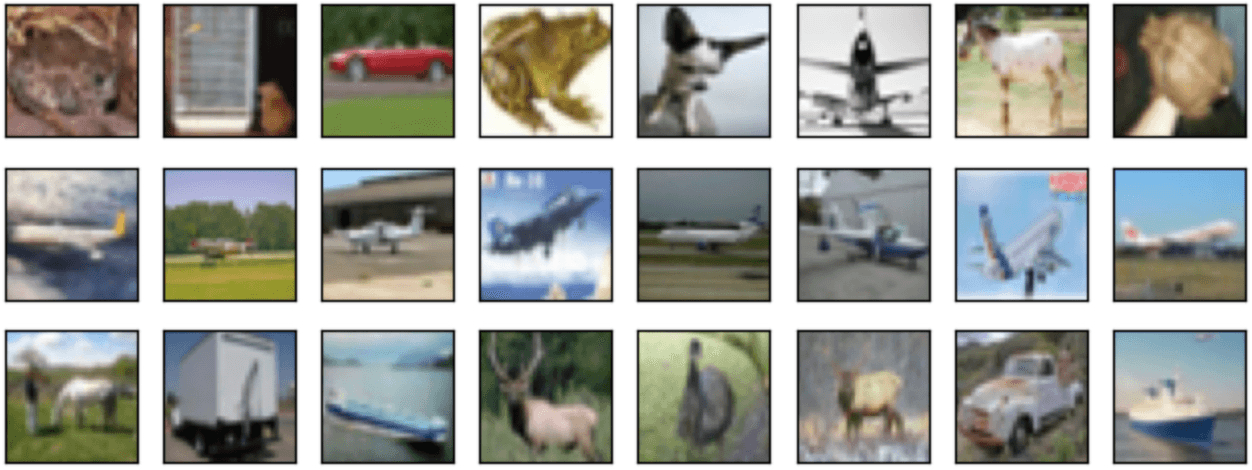
When applied to embeddings of the images from a ResNet-50 model, cleanlab gives this dataset a low p-value of 0.00032, indicating it detected something fishy. This example represents many large data collection processes where some examples are collected soon after another and end up having similar content. A common problem when scraping the web for image data is collecting multiple frames of a video. These examples would not be IID. While shuffling your dataset could ensure that these frames are randomly distributed, the issue remains that your dataset now overrepresents the contents of this video relative to other imagery and train vs. test sets may have more in common than expected. Cleanlab is able to detect if a section of your image dataset contains frames from the same video.
Scoring individual datapoints
The previous example gives us a chance to demonstrate additional cleanlab functionality that can help you determine not just that something is wrong with your dataset, but also what might be wrong. The aforementioned p-value quantifies the evidence that the overall dataset is not IID, but cleanlab’s non-IID check also assigns a score (between 0 and 1) for each individual datapoint. This is done by computing the same test statistic used for the whole dataset but only for the neighbors and non-neighbors of an individual datapoint. The resulting statistic is then mapped to lie within [0, 1] such that scores near 0 indicate datapoints for which the index-distance distributions to its neighbors and non-neighbors are significantly different.
Unlike other data issues that cleanlab identifies (e.g. label errors, outliers, near duplicates), direct interpretation of the individual datapoint scores is less clear for the non-IID issue type. These scores are intended to help you determine why a dataset received a low p-value from the non-IID test, but may not always have a clear interpretation. Plotting the datapoint scores vs. the datapoint ordering is more instructive than the values of the scores themselves.
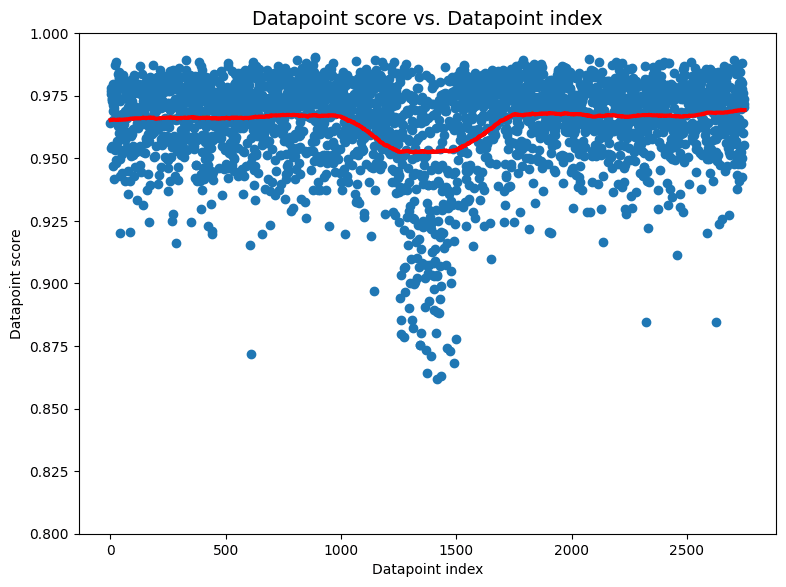
For the previously mentioned image dataset, we see is that most scores lie close to 1.0 which is what we would expect if there were no IID problems in the dataset. But in the middle of the dataset—around indices 1,200-1,500—there is a sharp downward spike in scores. Ignoring the specific values of the scores, this very structured departure from the expected distribution of scores is a sign that something problematic is happening around indices 1,200-1,500 in our dataest. Inspecting images in this part of the dataset reveals that all images between the 1,250th and the 1,500th happen to be airplanes!
Additional image datasets
Concept drift
One common way datasets can be non-IID is concept drift — also known as distribution drift, where the underlying population or collection procedure changes over time. To create an image dataset with this issue, we sample images from CIFAR-10 in a way that evolves distributions of classes of images over time. At first, images are sampled from any object class with equal probability. Then, we gradually adjust the sampling weights such that the final third of the dataset is sampled with asymmetric class weights such that some classes are far more likely to be sampled than others.
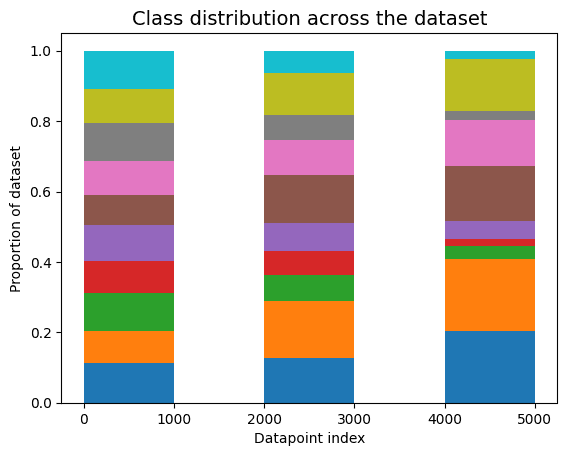
When applied to this dataset suffering from concept drift, cleanlab’s non-IID check outputs a low p-value = 4e-5. Concept drift can seriously affect model training and deployment performance if not identified and properly handled.
Extreme drift
What if our entire image dataset is ordered by class? That is, all the birds were collected first, then all the dogs, then all the cats, etc. A visualization of this is shown in the image grid below, in which each row contains only images of a particular class.
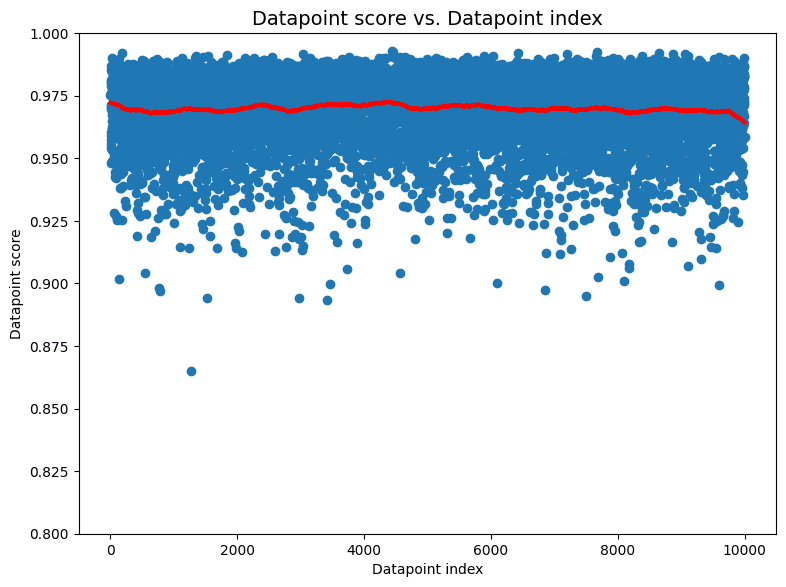
We create a dataset like this with 1000 images from each class, followed by 1000 images from the next class, and so on. When applied to this dataset suffering from extreme drift, cleanlab’s non-IID check outputs a p-value of essentially 0. The corresponding non-IID datapoint scores for this dataset are also interesting.
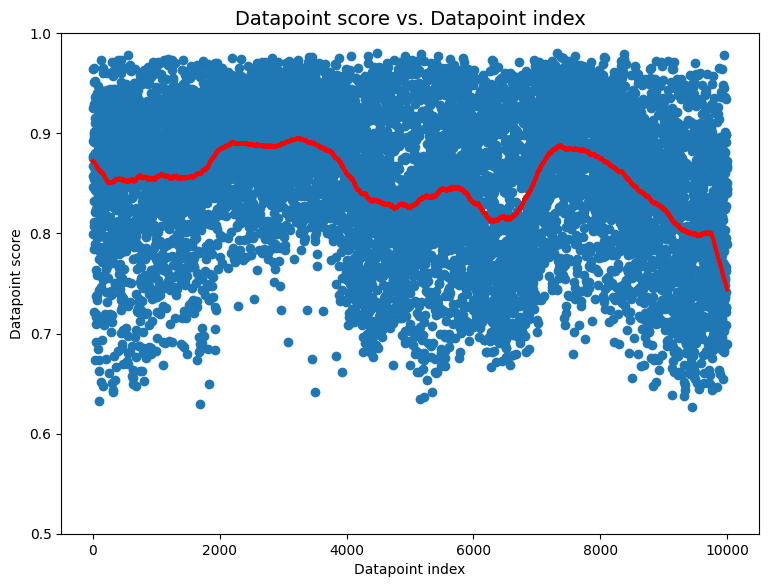
These datapoint scores exhibit clear structure that differs significantly from what we would expect for IID data (uniform band of high scores). Here the individual scores that are lower than others don’t elucidate what is wrong with the dataset. The global shape of the scores is more informative. The scores seem roughly grouped with sudden, regular shifts occurring every 1000 datapoints or so. This is an indication to inspect datapoints around each of these shifts to investigate what might be happening. In this case, the sudden shifts align with the transitions between classes from which images are collected in the dataset one after another!
Shuffled image data
The previous image examples showed that cleanlab’s non-IID detection algorithm is sensitive to a number of commonly-encountered violations of the IID assumption. Here we randomly shuffle the ordering of our same image dataset to make it truly IID. In this case, running cleanlab produces a comfortably high p-value of 0.78 and the individual datapoint scores (shown below) don’t indicate anything suspicious.
Additional Gaussian datasets
We also show a few more instructive examples using cleanlab’s non-IID detection method on data drawn from the same 2-D mixture of Gaussians we used in the first example of this article.
Evolving average
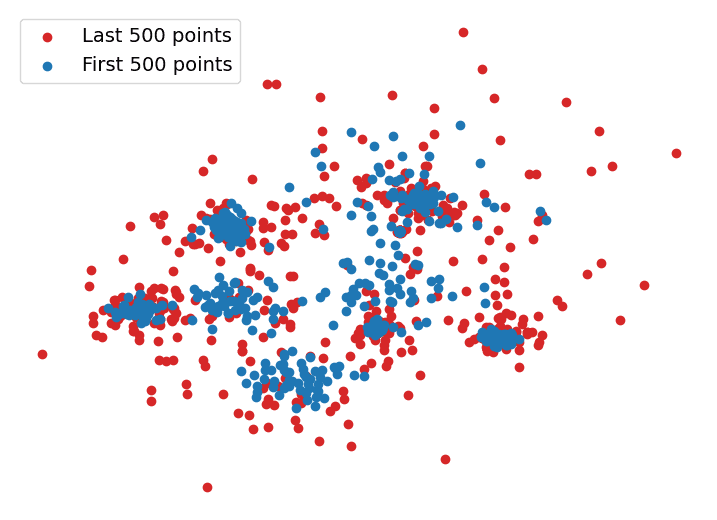
Our next dataset is constructed by starting with the same 2-d Gaussian mixture distribution as before, but each time we collect a datapoint, the mean of each Gaussian shifts a little toward the top right. Unlike our first example, the variance of the distributions does not change.
For this dataset with a gradual mean shift, cleanlab also produce a p-value near 0, correctly identifying its non-IID nature.
Identically distributed but not independent data
Finally, we consider a more subtle case. For our final dataset, we first independently sample three points from a standard 2-D Gaussian distribution. Then each additional datapoint, is sampled from where (we set ). In this case, all datapoints are identically distributed via the same marginal distribution, but they are not independent (since each datapoint’s values depend on previous datapoints).
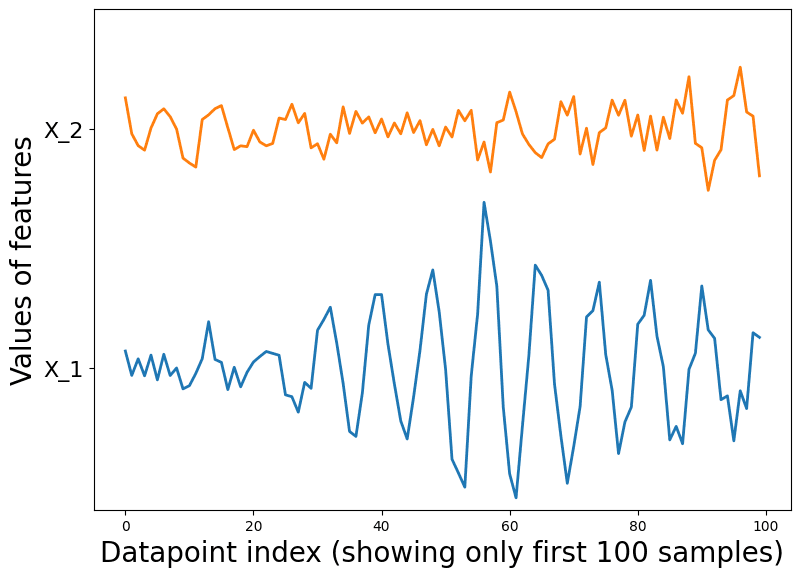
It is visually hard to tell that anything funky is going on in this dataset. Looking closely, you can see datapoints tend to appear in small clusters of 2 or 3, which wouldn’t happen as often if the datapoints were sampled independently. The sequential plot demonstrates the cyclical behavior of the features in the dataset. This hints at the fact that the samples may not be independent.
Running cleanlab on this challenging dataset, it correctly identifies that the data are not IID, producing a p-value near 0 for this dataset.
All of the diverse datasets highlighted throughout this article demonstrate how widely effective our kNN approach is. Read our paper to learn more, and use cleanlab to quickly verify whether your own data are not IID!
Resources
- Example Notebook to reproduce all results presented in this article.
- cleanlab open-source library with source code and tutorials for our non-IID check.
- Cleanlab Studio: automated data improvement solution to fix issues like this.
- Cleanlab Slack Community: Join our community of scientists/engineers to see how others deal with non-IID data, and help build the future of open-source Data-Centric AI!
References to learn more about handling non-IID data
-
Stanford Data Science article on why randomly splitting data is unwise if your data is not IID.
-
StackExchange post on why the IID assumption matters.
-
Rose-Hulman course notes explaining what IID sampling means and why it matters.
-
Blogpost on the impact of non-IID data on federated learning algorithms.
-
Notes from the National Institute of Standards and Technology on testing if data is IID.