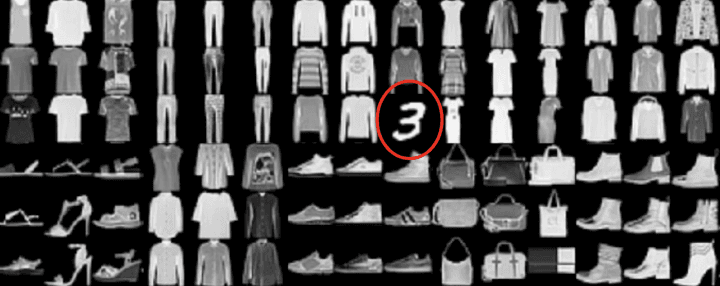
Reliability is the Achilles’ heel of today’s ML systems, whose predictions become particularly unreliable for Out-Of-Distribution (OOD) inputs stemming from a different distribution than previous training data. While such outliers are filtered in curated ML benchmarks, real-world data is full of them. Researchers have proposed many complex OOD detection algorithms, often based on specially-designed generative models for a particular data type. Here we demonstrate two much simpler methods that suffice to effectively detect outliers. Now available as open-source code in cleanlab.outlier, these methods can be easily run on any type of data for which a feature embedding or trained classifier is available.

We extensively researched the efficacy of our OOD detection algorithms in these publications:
Back to the Basics: Revisiting Out-of-Distribution Detection Baselines ICML Workshop on Principles of Distribution Shift, 2022
A Simple Adjustment Improves Out-of-Distribution Detection for Any Classifier Towards AI, 2022
Our methods can be used in the most standard OOD detection setting, in which (optionally labeled) training data is available, and we must flag (unlabeled) test examples that do not stem from the same distribution (also referred to as outlier/anomaly/novelty detection or open-set recognition). No specific examples of outliers are required. Consider an example application in autonomous vehicles, where the training data may not contain a strange object encountered on the road, and good OOD detection can ensure the system does not blindly trust ML predictions about the unknown object’s behavior.
OOD detection based on feature embeddings
For data with entirely numerical features or a clear way to define the similarity between examples, a straightforward approach to score how atypical an example is via its average distance to its K-Nearest Neighbors (KNN). This KNN distance allows us to score new test examples individually against previous training data. While it used to be less clear how to extend such an approach to non-metric data like images/text, their similarity can today be effectively measured between feature embedding vectors formed by a neural network’s representations. The deep learning community has developed amazing neural embeddings of all types of data. When labeled training data are available, better feature embeddings can be obtained by fine-tuning a pretrained network via supervised learning.

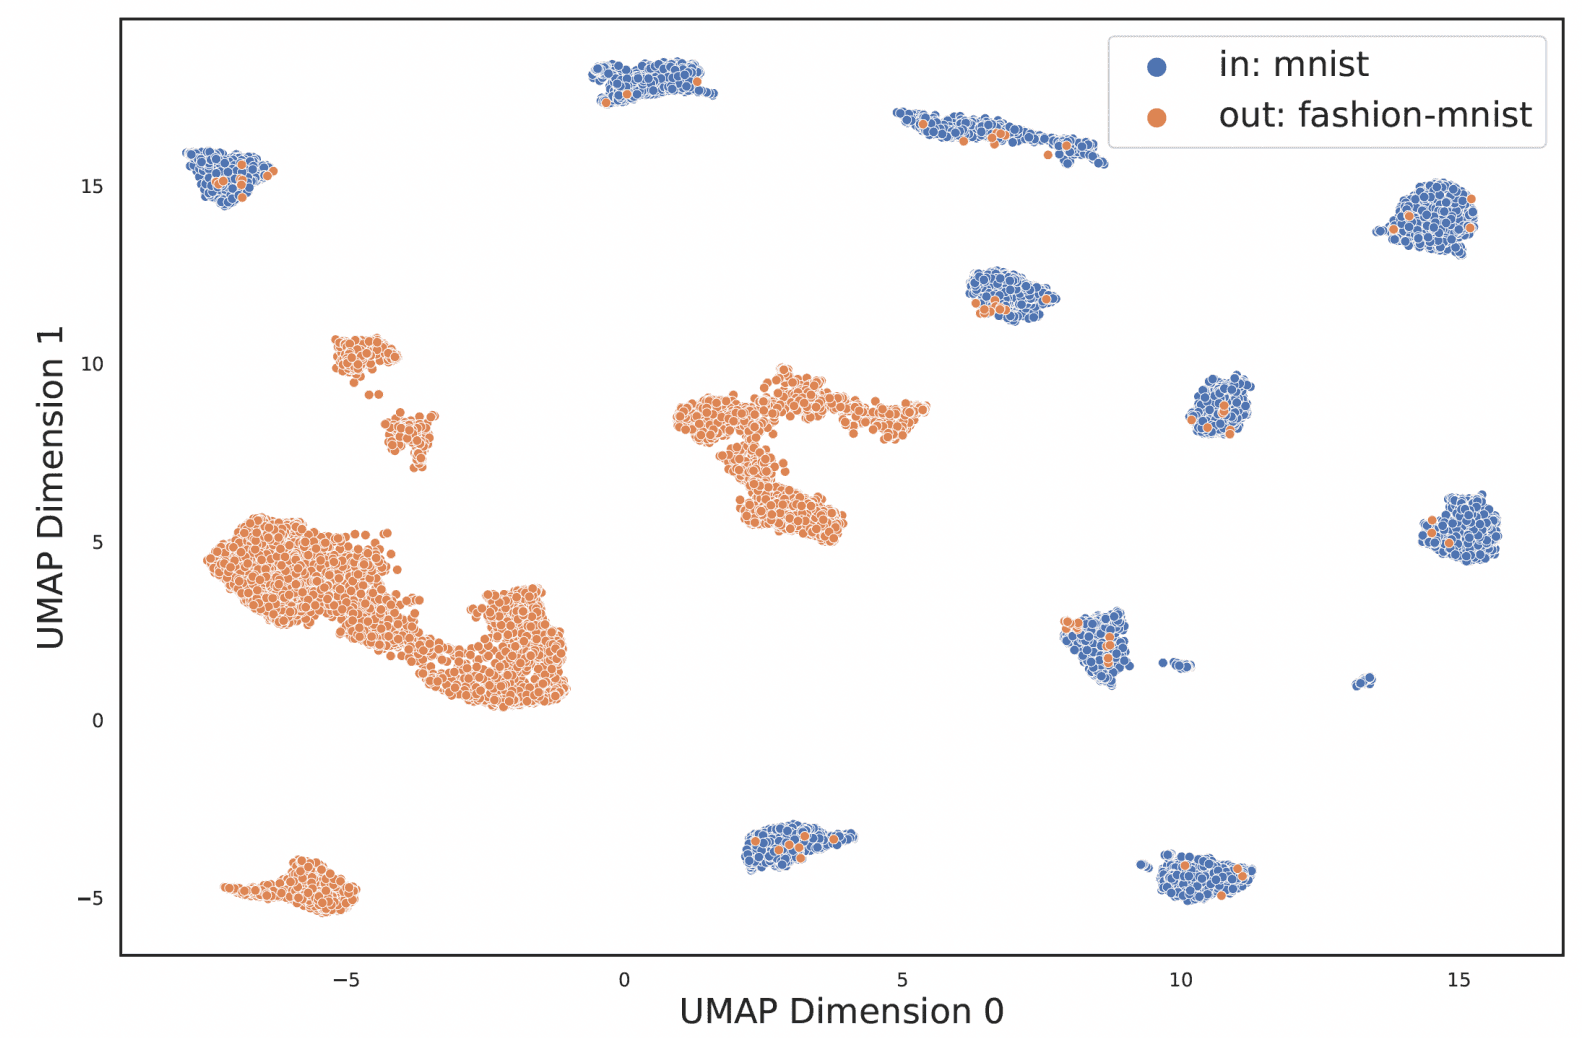
Figure: Feature embeddings of images from MNIST and Fashion-MNIST datasets (visualized after dimension reduction to 2D) obtained from a Swin Transformer model trained on MNIST images (here considered the In-Distribution data with Fashion-MNIST images considered OOD).
Despite being extremely simple, this KNN Distance approach has been neglected in other studies. Our research discovered this is a very effective way to identify OOD images and is not too sensitive to the choice of . We compared it against many popular existing OOD detection algorithms on multiple image datasets, obtaining feature embeddings for the images from standard image classification networks like ResNets and Swin Transformers.

Table: Evaluating how well (via AUROC) various OOD methods are able to detect Out-of-Distribution images mixed into an In-Distribution dataset. See our paper for more results.
OOD detection based on classifier predictions
We sometimes wish to detect outliers in classification datasets where it is unclear how to measure similarity between examples. A popular approach that can be surprisingly effective is to only use the predicted class probabilities output by a trained classifier and quantify their uncertainty as a measure of outlyingness. Two common OOD measures are the Maximum Softmax Probability (MSP) or the Entropy of these predictions. However these methods ignore the crucial fact that trained classifiers are inevitably flawed with different propensity to predict different classes (especially if the training data are imbalanced).
Leveraging some of the ideas that cleanlab uses to confidently detect label errors, we developed a simple adjustment of classifier predictions to account for this issue that leads to significantly better OOD detection when the aforementioned OOD measures are computed over adjusted predictions instead. Our proposed adjustment normalizes the predicted probabilities for a particular example by the model’s overall propensity to predict each class amongst the examples labeled as that class (mathematical details here).

Table: Evaluating how well (via AUROC) various OOD methods are able to detect Out-of-Distribution images mixed into an In-Distribution dataset. See our article for more results.
Relying on features vs. predictions?
Detecting outliers based on feature embeddings can be done for arbitrary unlabeled datasets, but requires a meaningful numerical representation of the data. Detecting outliers based on predicted probabilities applies mainly for labeled classification datasets, but can be done with any effective classifier. The effectiveness of the latter approach depends on: how much auxiliary information captured in the feature values is lost in the predicted probabilities (determined by the particular set of labels in the classification task), the accuracy of our classifier, and how properly its predictions reflect epistemic uncertainty. In our benchmarks, our feature-based OOD detection was more effective across numerous image datasets we studied, when the network to produce feature embeddings was first fine-tuned as a classifier using labeled training data.
A couple lines of code can detect OOD examples in your data
Both feature-based and prediction-based OOD detection are very easy to use in the open-source cleanlab library. Here is all the code you need to detect OOD examples in a dataset based on feature embeddings:
And here is all the code you need to detect OOD examples in a dataset based on predicted class probabilities from a trained classifier:
When the training data is a subset of CIFAR-10 comprised of only the animal images, the top outliers this code identifies amongst the CIFAR-10 test data are all non-animal images:

The underlying algorithms run are those that performed best on real data in our two studies. The prediction-based OOD detection code executes the classifier prediction adjustment described above, and feature-based OOD detection uses the average distance to the K Nearest Neighbors. cleanlab can automatically identify these nearest neighbors for you, but you can also opt to use an approximate nearest neighbors library of your choosing as demonstrated in this example.
Resources
- Quickstart Tutorial: find OOD examples in your data in 5min.
- Example Notebook: an advanced application of OOD image detection with AutoML and approximate neighbors.
- Back to the Basics paper: studies many OOD detection methods based on features and predictions.
- Simple Adjustment article: introduces our proposed method for OOD detection based on classifier predictions.
- Code to reproduce all of our benchmarks.
- Towards Data Science article on Understanding Outliers in Text Data with Transformers, Cleanlab, and Topic Modeling.
- cleanlab open-source library
Join our community of scientists/engineers to see how others are dealing with OOD data, ask questions, and help build the future of Data-Centric AI: Cleanlab Slack Community
Easy Mode
Want to try the fastest way to detect and handle OOD data / outliers in any image, text, or tabular dataset? Use Cleanlab Studio.
While the cleanlab package helps you automatically find data issues, you’ll need ML expertise as well as an interface to efficiently fix these issues your dataset. Providing all these pieces, Cleanlab Studio finds and fixes errors automatically in a (very cool) no-code platform (no ML expertise required). Export your corrected dataset in a single click to train better ML models on better data.


