


Noise plagues many numerical datasets, where recorded values in the data may fail to match the true underlying values due to reasons including: erroneous sensors, data entry/processing mistakes, or imperfect human estimates. This blog summarizes our paper introducing a new algorithm to estimate which values in any numerical data column are likely incorrect. We added this algorithm to our open-source library for you to automatically validate your own datasets.
Our approach fits a regression model to predict values in the column of interest based on the other columns in the dataset, thus accounting for all available information. Our method accounts for key sources of uncertainty and is more effective than conformal inference or RANSAC.
Our algorithm scores each datapoint based on how likely its value is correct, as well as estimating how many datapoints’ values were corrupted. You can sort by these data-quality scores to prioritize the most-likely corrupted datapoints for subsequent review. Our error detection procedure works with any regression model for your data that supports a standard fit() and predict() interface. Thus you can also apply it to image/text/audio data with associated numerical outcomes. See our paper for mathematical details, theoretical analysis, and benchmarks:
Detecting Errors in Numerical Data via any Regression Model

Estimating data quality scores
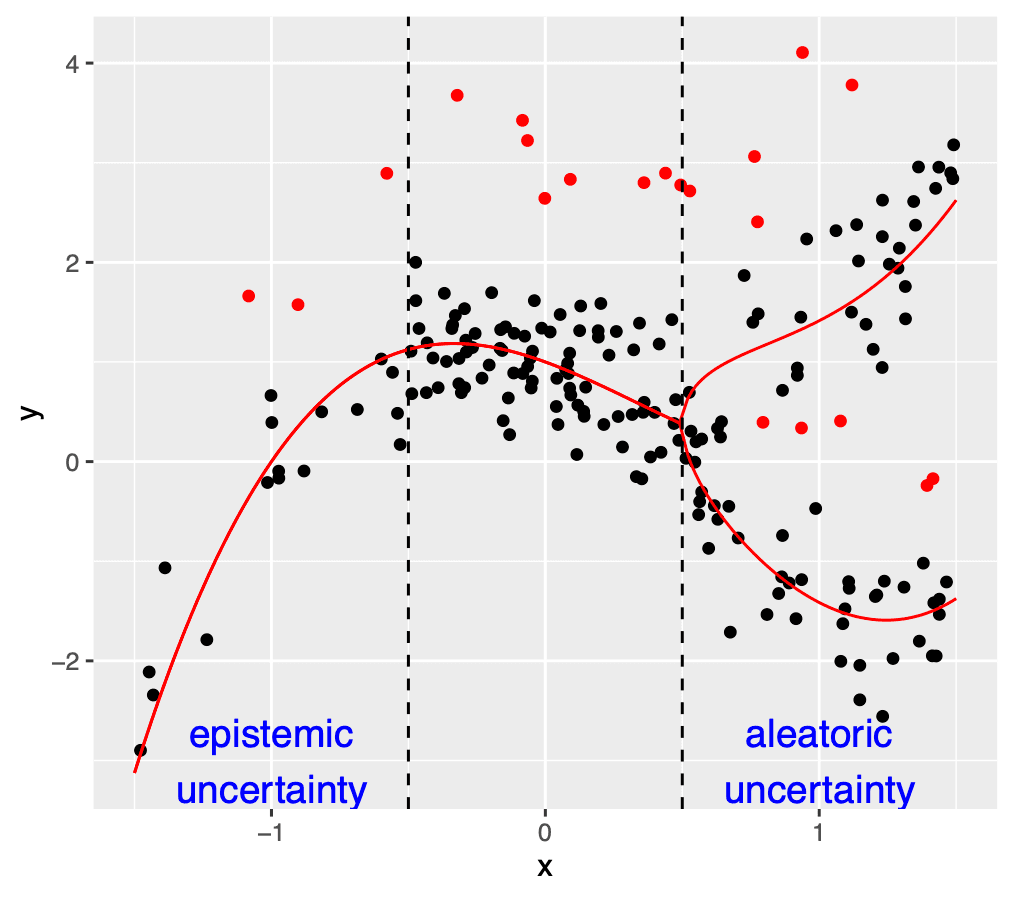
One basic way to utilize a trained regression model to identify erroneous values is to simply take the residuals of the model predictions as a (inverse) data quality score. Recall a residual is the deviation between predicted value and observed value in the data. However this basic strategy fails to account for prediction errors from the model. Assuming the regression model was not fit sloppily, one particular residual might be unusually large for 3 reasons:
- The observed value in the data is actually erroneous.
- The model produced a poor prediction because there are few similar datapoints in the dataset (high epistemic uncertainty).
- There is high aleatoric uncertainty because values like these are fundamentally hard to predict due to inherent stochasticity in their underlying relationship to the other data columns (e.g. heteroscedasticity).
Our algorithm uses your regression model to directly estimate the aleatoric uncertainty (by fitting a second copy of your model to predict residuals’ magnitudes) as well as the epistemic uncertainty (by fitting multiple copies of your model with bootstrap resampling). Subsequently, we produce a quality score for each datapoint that rescales its residual by a combination of its estimated aleatoric and epistemic uncertainties. This reduces the opportunity for reasons #2 and #3 to induce low quality scores for uncorrupted datapoints. Thus our scores are much more effective for prioritizing erroneous data than relying on residuals alone.
Estimating the number of corrupted datapoints
Beyond estimating quality scores for ranking datapoints, we’d also like to estimate how many erroneous values our dataset contains. Our algorithm sorts the data by quality score and then fits another copy of your regression model after omitting the bottom % of the data (with worst quality scores). We repeat this for different values of , and select the value that leads to the best out-of-sample value from the corresponding regression model.
Intuitively, omitting correct data is expected to harm the performance (less training data leads to worse predictions). In contrast, omitting corrupted data can improve performance. Thus we estimate the fraction of our dataset that is corrupted by omitting more and more of the most-likely-corrupted data until the stops improving.
How effective is the algorithm?
Evaluating algorithms to detect erroneous values is highly nontrivial. We’ve released the first benchmark for doing so with 5 real numerical datasets with naturally-occuring errors. Each dataset has many feature columns and a target column in which we detect errors. There are separate high-fidelity and low-fidelity versions of the target column. For instance, one benchmark dataset involves air quality measurements where the high-fidelity values come from a high-quality sensing equipment whereas the low-fidelity values are measured using an inferior sensor. Another benchmark dataset involves human-determined politeness ratings for text where the low-fidelity values come from a single annotator, whereas the high-fidelity values are the consensus across many annotators. For benchmarking, we apply our algorithms to the low-fidelity version of the dataset, reserving the high-fidelity version solely to determine which low-fidelity dataset values are actually erroneous.
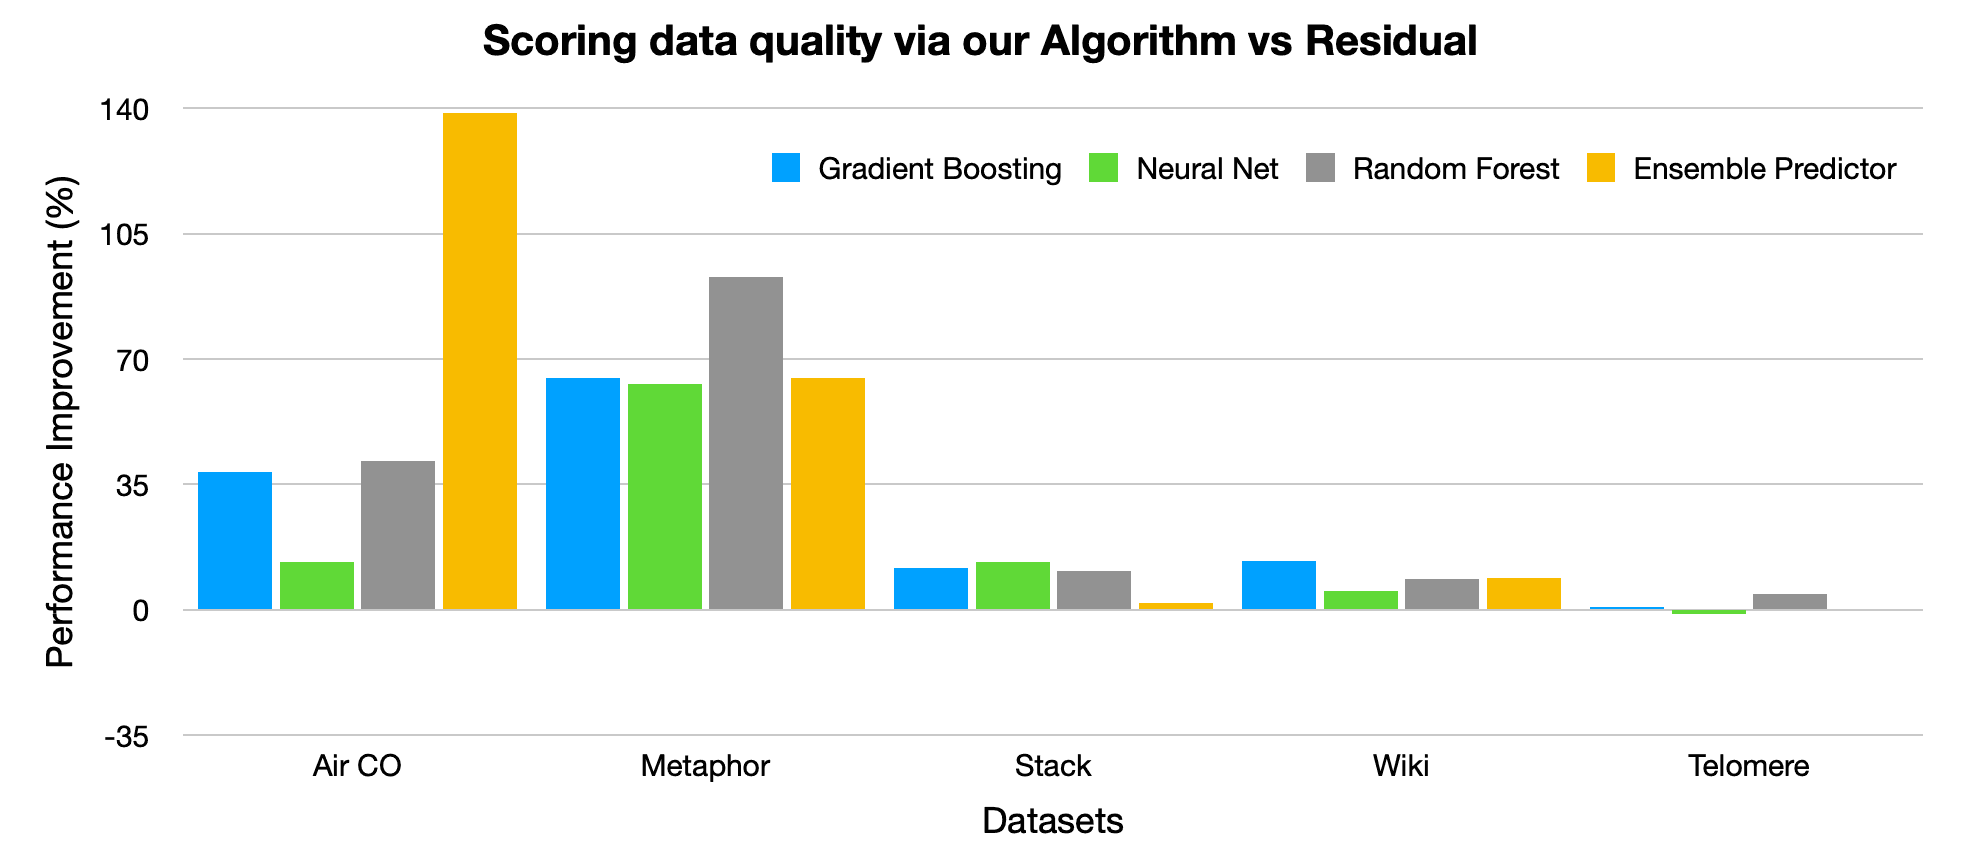
For each of the 5 benchmark datasets, the figure below reports the improvement in label error detection accuracy (specifically, percentage improvement in Area under the Precision-Recall curve) achieved by our algorithm for estimating data quality scores vs. using the basic residual instead. Here we run each method with 4 popular types of regression models, and in nearly each case, our algorithm identifies incorrect values with better precision/recall than just using the residuals.
Our paper reports many additional benchmarks, revealing that our algorithm also more accurately identifies erroneous values than alternative approaches like conformal inference (which also quantifies uncertainty) and Random Sample Consensus (RANSAC – which also utilizes iterative data filtering).
How do I use this on my datasets?
Open-sourced as part of the cleanlab library, our algorithm can be run on your data with a single line of Python code! Just follow this quick tutorial notebook.
All you need to provide is a scikit-learn compatible regression model (your_regression_model) and specify your label column (ie. the column to audit for erroneous values) as y with your dataset’s other feature-values provided as X (as is standard practice in scikit-learn). After that, here’s all the code to find likely erroneous entries (issues) amongst the y-values:
While most models can be easily wrapped to be scikit-learn compatible, cleanlab also offers a simpler/faster algorithm to identify erroneous numerical values just based on out-of-sample predictions from your already-trained regression model like this:
As demonstrated in our paper, the former code will better detect errors than the latter code in most cases.
Easy Mode
Want to try the fastest way to detect and correct errors in numerical data? Get started with our Cleanlab Studio API tutorial.
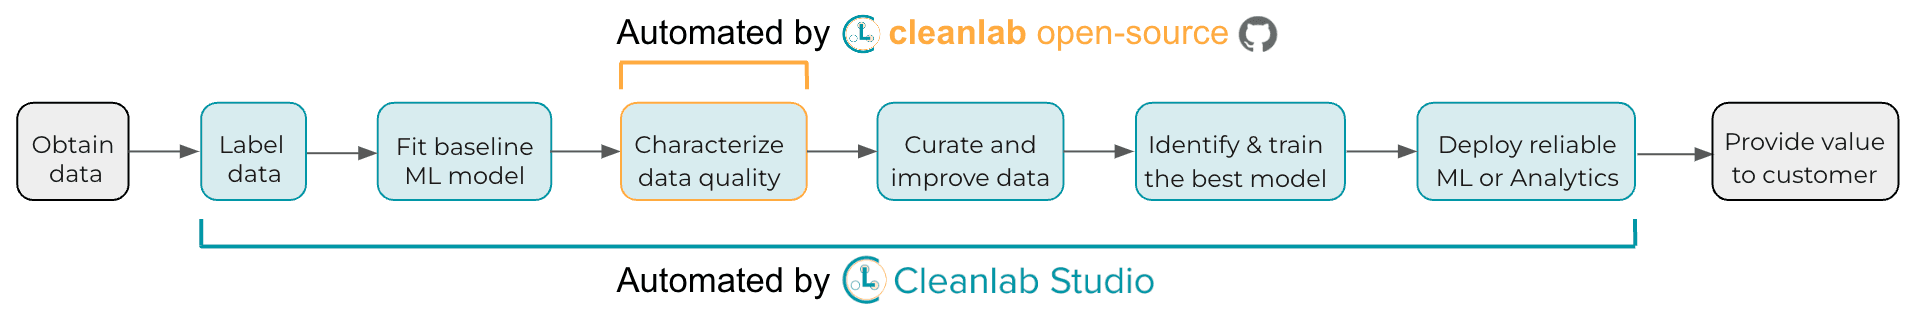
While cleanlab helps you automatically find data issues, an interface is needed to efficiently fix these issues your dataset. Cleanlab Studio finds and fixes errors automatically in a no-code platform (no ML expertise / regression modeling required).
Resources to learn more
- Paper containing all the mathematical details, theoretical explanations of the effectiveness of our algorithm, and extensive comparisons against other methods
- cleanlab open-source library
- Cleanlab Studio: no-code data improvement
Join our community of scientists/engineers to ask questions, see how others are using algorithms to improve numerical data, and help build the future of Data-Centric AI: Cleanlab Slack Community